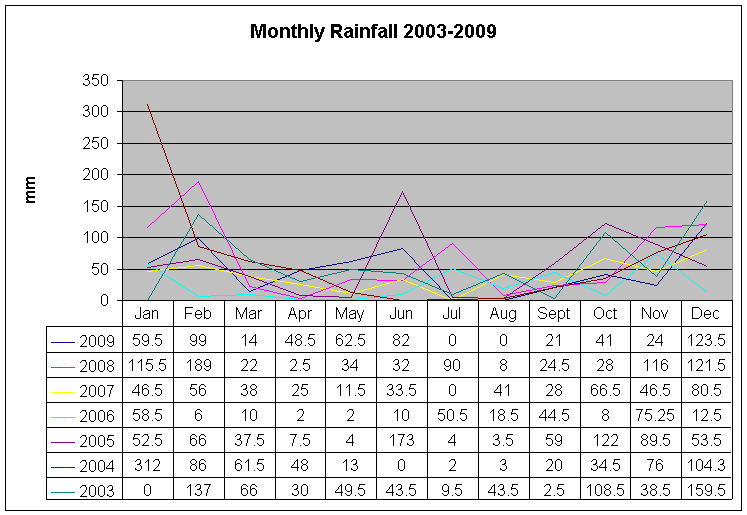
(1) Even
though we only received 5mm, storms formed just south of Kingaroy
and the airport had 24.6mm. A friend, further south, in the Haly
Creek - Ellesmere area had 31mm.
(2)
Finally, just before midnight on the 20/2/2009 we
had a storm front similar to "the old days", meaning how I remember
rain before 1974. It dumped down until around 1.00am. It was so
heavy it woke me and I stood and watched. After the initial wind,
the drops fell straight down so hard and so intense that the volume
going into the tank strainer had no chance of allowing the water
through and it poured down the sides of the tank. Luckily both of
our tanks are full.
(3)
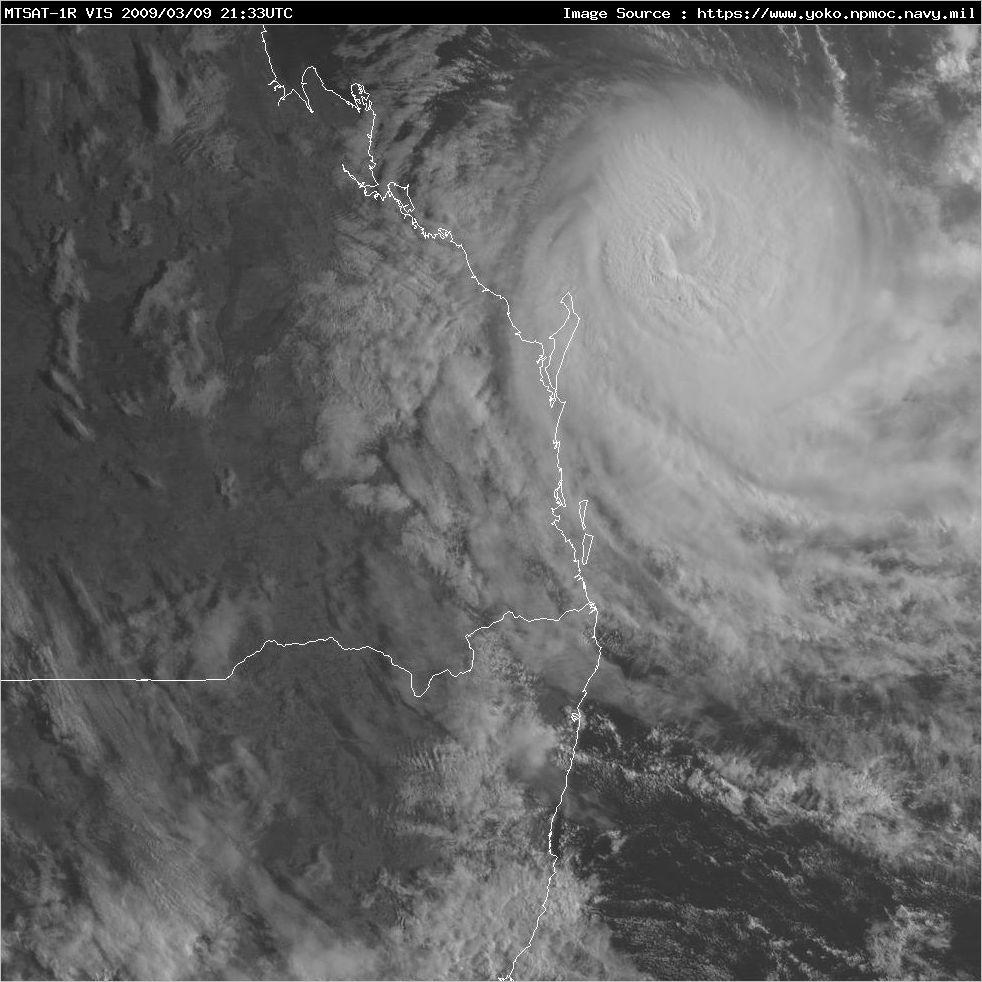
Cyclone HAMISH has been wandering parallel to the QLD coast and
has managed to get as far as Fraser Is as a Category 3
after reaching Category 5 earlier in it's path from where it
started, near Cooktown.
Our massive rainfall out of this system up till now is shown,
.5mm !
The Extended Outlook from BOM says this:
"EXTENDED OUTLOOK
Tropical Cyclone Hamish is expected to slow down and gradually
weaken over the
next day or so before moving slowly north-westwards as a decaying
low. At the
same time the high over the Bight area will move into the Tasman Sea
and
continue to move eastwards reaching the New Zealand area on
Saturday. The
remains of Tropical Cyclone Hamish will spread rain and shower
activity across
most of the south-east on Thursday. Some moderate to heavy falls
will occur with
this rain especially near the low. This rain and shower activity
will continue
through Friday as an upper trough moves into the south-east of the
state. This
upper trough will pass seawards overnight Friday. As a result only a
few showers
will occur about the south-east of the state on Saturday and Sunday
and then
mainly near the coast."
So, hopefully we may still get some
rain from the washup
The visible image below was taken at 7.33am 10th March,
Eastern Standard Time, Australia.
Image courtesy of the
NPMOC (Yokosuka)
 (4)
More flooding feared as SE Qld mops up
Friday April 3, 2009 - 08:02 EDT
Emergency crews have responded to more than 200 calls for help after
heavy rain caused flash-flooding on the Sunshine Coast in south-east
Queensland.
The deluge began early yesterday and quickly swamped the region,
with many roads still under water.
Several motorists were rescued from flooded roads, while students at
two Sunshine Coast schools were stranded and spent the night in
their classrooms.
The heaviest rain fell at the Gold and Sunshine Coasts overnight.
Maroochydore had 127 millimetres to 7am AEST and Coolangatta had 124
millimetres.
Brisbane received almost 66 millimetres.
Noosa State Emergency Service (SES) spokesman Dave Hanchard says
conditions are dangerous on the roads.
Mr Hanchard says they were kept busy rescuing stranded motorists.
"The majority were people stuck in cars or they had gone into the
water and driven off the road and commonsense would dictate you
don't go into floodwaters - the way the water was running in some
places was up to 20 knots," he said.
He says a team of firefighters drove into a washout while responding
to an emergency.
"We have got two cases of where roads have collapsed - this is how
easy it is - the firies know the road they drove into [was] a
washout so it can happen to the most experienced people," he said.
Disaster management spokesman Jason Cameron says the flood situation
is still being assessed.
"This morning will be about having a look at that - what sort of
affect that will have and we'll determine it from there," he said.
"We really need to look and see what the hydrologists have to say
about that but certainly it would be a moderate amount of water that
we just need to monitor closely."
All state schools on the Sunshine Coast are open.
Education Queensland spokesman Rod McAlpine says the students
stranded at Pomona High School overnight will return home when
floodwater recedes.
"In Kin Kin, I haven't been able to make contact with the school yet
this morning, but as of last thing last night there were still 14
children, three staff and six adults who were planning to spend the
night there," he said.
Weather bureau spokesman Gavin Holcombe says there could be more wet
weather to come.
"We are still going to see further showers, tending to rain at times
along both the Gold and Sunshine Coast for the next 24 to 48 hours
that may produce the odd heavy fall in the ranges in the back of
those coasts," he said.
"But it will be nothing like what we had, so while the heavier falls
are gone, we are still going to see further precipitation around the
area.
"We are more than likely see an increase in rain again, probably
during Sunday.
"We have got another upper trough system moving into the state
during Saturday going into Sunday and that is going to increase the
uplift over the south-east part of the state - probably see the rain
increase."
While the rain has eased in some areas, Mr Hanchard says emergency
services are concerned about swollen catchments and the water likely
to flow downstream toward the coast.
"Unfortunately we are not out of the woods yet as far as the SES
goes, because now we have got to contend with whatever run-off is
going to come down from up in the hinterland, so it is not going to
take much," he said.
"If this rain holds off several hours we might stand some chance."
More than 500 homes and businesses in the Sunshine Coast region are
without power this morning.
Energex says the worst affected areas are in the hinterland of the
Mary Valley and Gympie.
The Sunshine Coast hinterland town of Kin Kin has been hard hit by
the flooding.
Access to the town is difficult with logs from a sawmill strewn
across the road at one end of town and the bridge at the other end
badly damaged.
Cherry Wynne works at the local hotel and says the building was
inundated.
"It's a two-storey pub and it was lapping at the top of the first
floor right up to the top ceiling there, but the second floor was
okay," she said.
"All our bar fridges at the back of the bar, that bar fridge is now
up on the bar."
Bruce Costin, who lives at Cedar Pocket near Gympie, says more than
200 millimetres of rain has fallen at his property in the past 24
hours.
"The Cedar Pocket Dam is a very fast-filling dam and she came up
very fast with that sort of drop and the Gear's Bridge below the dam
was maybe a metre over it," he said.
"All the approaches to that area were closed like the Kin Kin, Gap
Road and all that sort of stuff was closed."
Sunshine Coast Mayor Bob Abbot is hoping the worst has passed.
"I don't think we will have too much more problem now there is not
any more rain left up there," he said.
"We've had 26 inches in five hours - there is just no more water in
the sky - there can't be."
Gold Coast SES volunteers attended around 30 calls for help last
night as heavy rain fell across the city.
There were falls ranging from 100 and 181 millimetres from 9am AEST
yesterday.
Acting SES Gold Coast controller Chad Tripp says most of the
problems were leaking rooves.
"Most of the damage was caused by the amount of water and if your
gutters are blocked at all, it backs up and into your property and
basically you get a ceiling collapse or small leaks and it causes
havoc," he said.
Gold Coast City Council lifeguards will reassess local beach
conditions later today.
The city's beaches were closed yesterday as big seas pounded the
coast and they will remain closed until at least lunch time today.
Chief lifeguard Warren Young says conditions have eased .
"The swell has dropped as I said, but it's still not inviting -
there's still a lot of water moving in close and still a bit
unstable," he said.
He says there is debris in the water and lifeguards have also
retrieved some shark equipment that came loose in the heavy swells.
"Some has come in in the last couple of days and lifeguards
retrieved it for the contractor but we'll keep an eye on that as
well, but we've got to be careful with that," he said.
- ABC
© ABC 2009
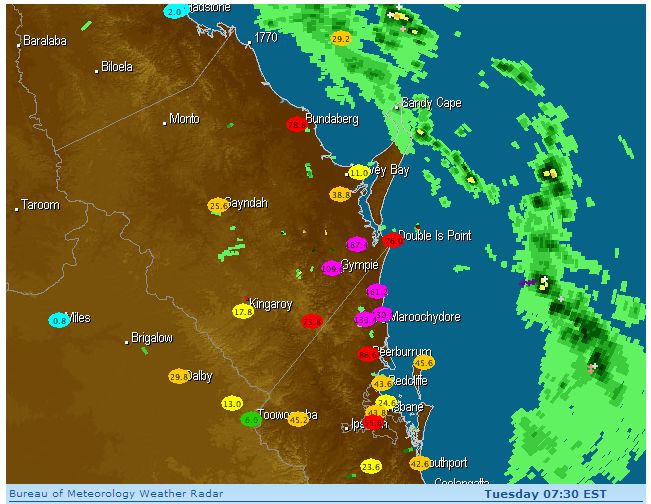
And what did we get? 3.5mm! (5)
Radar before I went to bed. As can be seen by the
rainfall totals, it was really heavy on the Sunshine Coast.
We were in the middle of two systems and getting near nothing. By
morning we'd received 17mm.
Thanks to Bureau of Meteorology and Weatherzone.
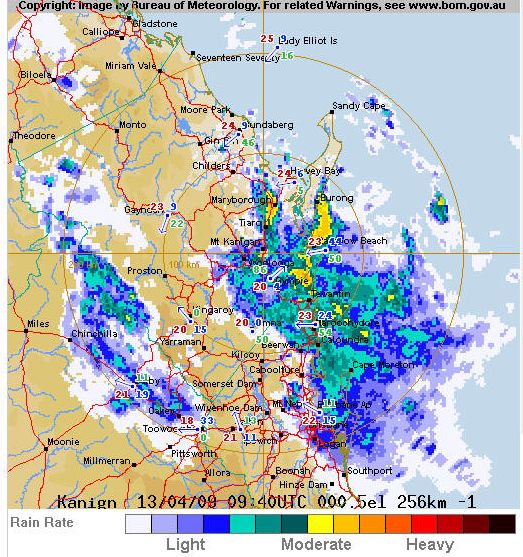
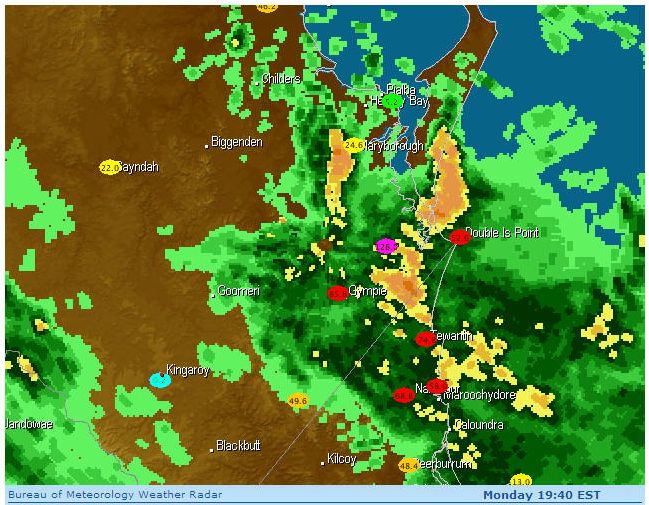
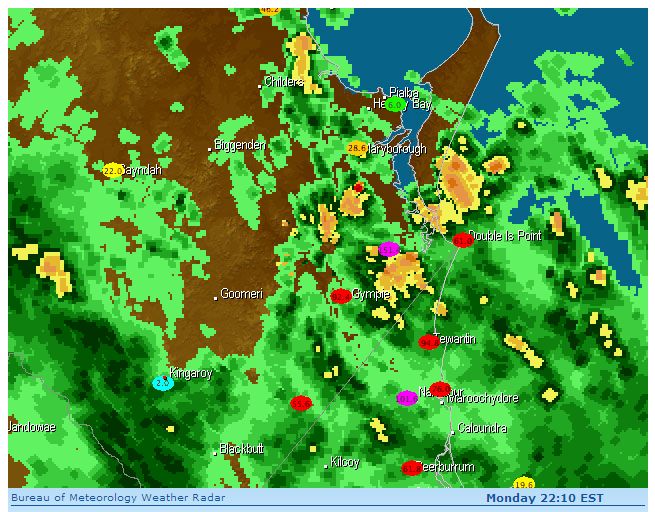
Below are figures for the areas around the south
east, the next morning.
(6)
Dust settles as storm rolls north
Wednesday
September 23, 2009 - 20:43 EST

Dirty haze: Brisbane was
shrouded in a cloud of dust.
-
ABC

Behind a veil: The Brisbane
skyline is swathed in dust
-
ABC

Eerie glow: The Sydney
Harbour Bridge is bathed in dust
-
ABC
Skies have cleared over Sydney and
Brisbane after an intense dust storm swept through the
cities, causing traffic chaos and leading to health
concerns.
The spectacular blanket of orange and yellow pollution
cloaked parts of New South Wales and Queensland and was
easily big enough to show up on satellite photos from
space.
The dust storm also hampered firefighting efforts in
Queensland, where more than 20 blazes raged around
Brisbane.
Residents are being told to expect conditions to return
to normal overnight and into tomorrow morning as the
dust storm continues its push north.
Emergency services have been on high alert, with
hundreds of calls from people suffering breathing
problems.
"We've had joggers come in, fit young men and women who
have just had real trouble breathing and we've had to
treat them," said Professor Gordian Fulde of St
Vincent's Hospital in Sydney.
People in Brisbane used scarfs and tissues to protect
themselves from the dust, while one hardware store in
the city's CBD handed out about 600 face masks in 40
minutes.
The worst dust storm in 70 years threw the plans of
commuters and travellers into chaos.
"Our one set of traffic lights in the town are showing
amber, amber, amber," one NSW resident said.
School was still on but morning Sydney ferries and
flights were delayed and cancelled.
"Six international flights were cancelled. The diverted
flights have progressively returned to Sydney and we are
getting departure delays for international flights of up
to six hours," Sydney airport spokesman Rod Gilmour
said.
"In relation to domestic flights, we've had delays of
about up to 180 minutes but things are now operating
normally at the airport."
There were also big delays for passengers at Brisbane
Airport.
"We were held up for an hour in Emerald and now I've
just got to run and get a Jetstar flight to Newcastle,"
one passenger said.
"I have been delayed by five hours in Cairns and have
probably missed the last bus home tonight to Toowoomba,"
another traveller said.
The conditions also forced tens of thousands of
construction workers to stop work at dozens of building
sites across Sydney.
Brian Parker from the Construction Forestry, Energy and
Mining Union says the windy weather created problems.
"With the high winds, it causes a number of problems
with the movement of materials [and] cranes operating,"
he said.
"So with the dust and also the wind, [it] could have
contributed to injuries and even fatalities."
Emergency Services and the fire brigade were also kept
busy with fallen trees and fire alarms that were
triggered by the dust particles.
Chris Eiser from the New South Wales Department of
Environment and Climate Change says the pollution
readings have been off the charts for much of the day.
"Particles we measured today are the highest we measure
since we started monitoring in the 1970s," he said.
"They are certainly far in excess of any levels we
measured during bushfires. For example, we're measuring
around 15,000 micrograms per cubic metre as a
concentration.
"Bushfires would normally get around 500 micrograms per
cubic metre and on a normal day that would be anywhere
between 10 and 20, so certainly a significant event.
It was an event that began hundreds of kilometres
inland. Topsoil from the drought-ravaged west of NSW was
stripped from the earth and pushed by huge wind gusts to
the east.
The haze smothered south-east Queensland, forcing
firefighters to temporarily ground water-bombing
helicopters.
With climate change a hot topic this week far beyond
Australia's shores, experts say extreme dust storms like
this could become more frequent.
Dr John Leys from the NSW's Department of Environment's
Dust Watch division says it looks like dust storms such
as this will become more prevalent.
"There has been a report from CSIRO that show that this
drought is the first of its type, because we've never
had droughts which have been so hot," he said.
"Things like this are going to be more prevalent unless
we can improve our land management practices so we can
maintain more ground cover, so there is less chance of
us all blowing away."
- ABC
© ABC 2009
Thanks to ABC and
Weatherzone A
similar day occurred 28/10/2003.
Here is a link.
(7) Finally, after over 3 weeks of dust,
haze, heat and generally dry, disgusting days, the wind direction
changed to the south east and brought some moisture in from the
coast.
At around 9.30 pm, on Sunday night 4-10-2009 (my 60th
birthday - great birthday present!), a blob showed up on radar about
15km south west of Kingaroy.
I watched the radar as the blob evolved into 1 heavy cell moving
north east towards Kingaroy. Other cells formed east of Kingaroy and
around Gayndah. The heavy cell divided into 2 as it moved towards us
and I thought we'd miss out again, but it came over us and rained so
heavily that the flow into the tank overshot the gauze filter.
I had to get drenched trying to point the flow downwards.
We lost a lot of water, so I'll have to put a deflector on the
spout.
(8)
After watching storm clouds build in the southeast
and hearing news of hail and heavy downpours, we received 3.5mm
in the odd shower. Just a few kilometres southwest of Kingaroy,
falls above 70mm were reported. The official BOM site
at the airport - only being a few kilometres south, which I can see
sitting here - even reported in with 17.2mm. As I write this,
storms are occurring at Dalby and the latest report says
20.4mm. It will be interesting to see if we get any decent falls
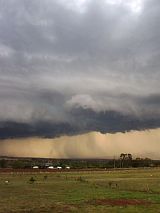
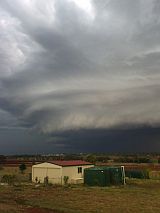
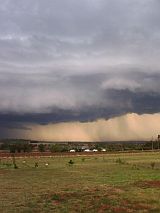
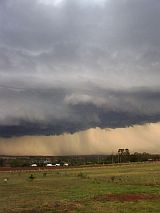
on this side of the Bunya Mts today.
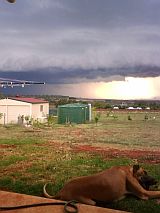
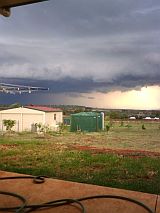
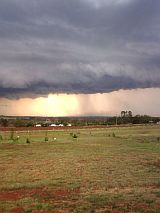
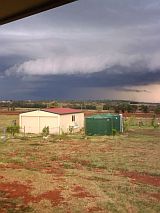
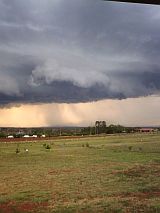
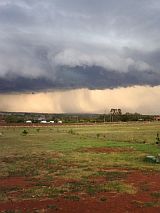
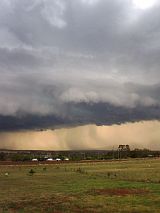
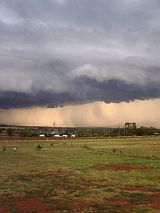
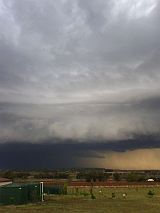
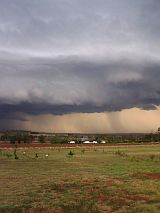
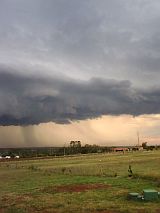
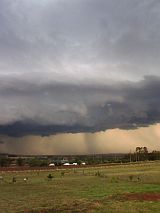
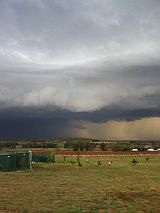
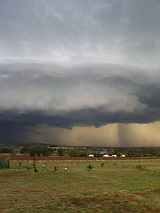
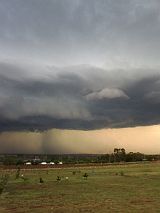
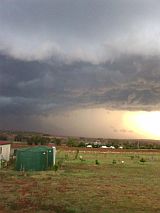
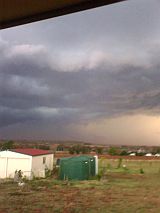
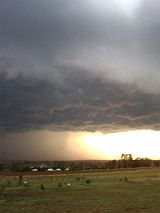
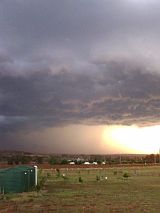
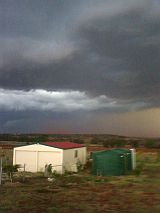
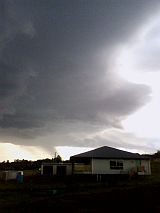
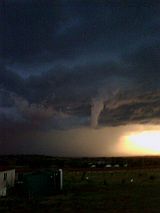
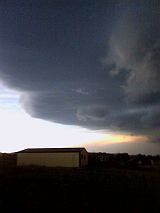
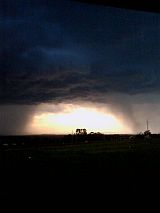
As you can see we received .5mm!!
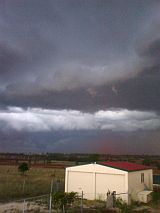
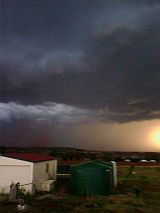
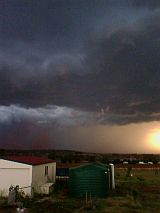
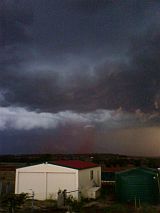
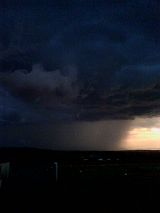
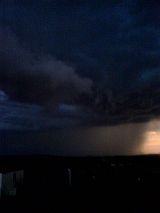
Below are some pathetic quality pics of the storm
that gave over 70mm to the Stuart Valley area just
south of Kingaroy.
As I only had my mobile camera with me as the storm approached, it
had to do, as I didn't want to miss the pics.
The storm looked really wild as it moved towards the area.
|