KINGAROY RAINFALL
2013
|
94549 - KINGAROY AIRPORT - 151.8398°E, 26.5737°S, 434m ASL KINGAROY Town - 151.5072°E, 26.3232°S, 437m ASL The rainfall ( in mm ) reported here is read from a commercial rain gauge mounted in the open on a post 2 metres off the ground at our home in Kingaroy itself, some 5km from the Kingaroy Airport. Here is a link to our States' water resources. (The Dam closest to our area is the Bjelke-Petersen Dam) SunWater -
Queensland Water Storage Information
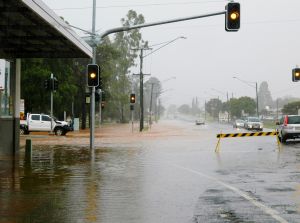
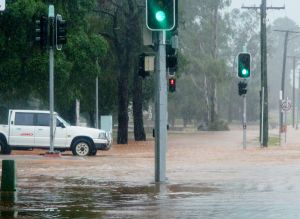
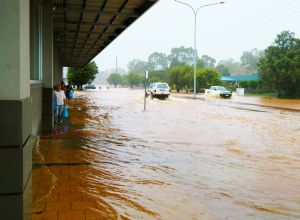
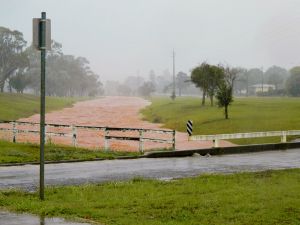
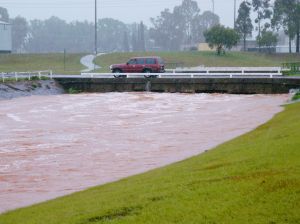
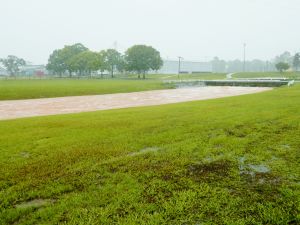
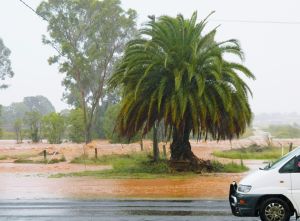
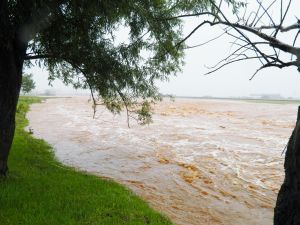
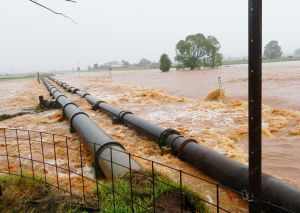
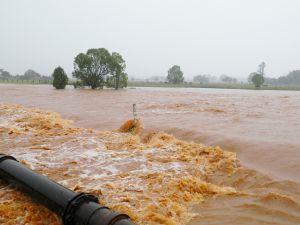
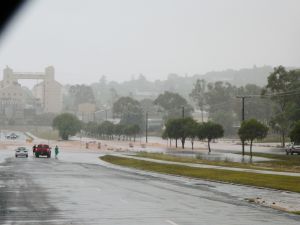
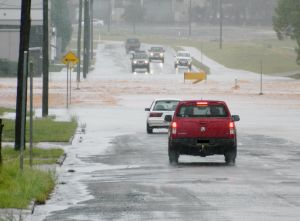
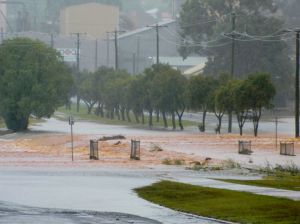
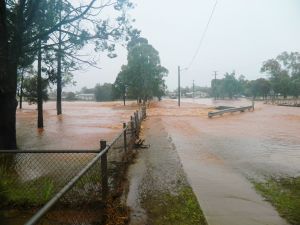
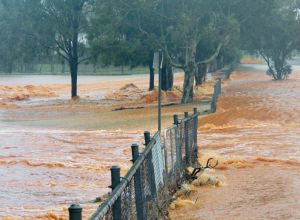
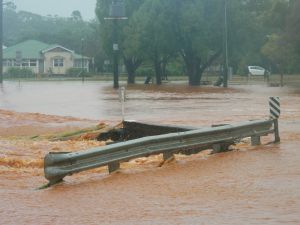
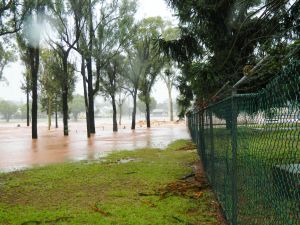
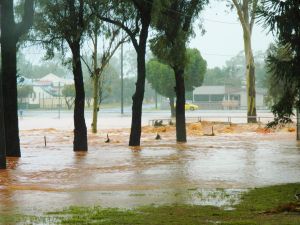
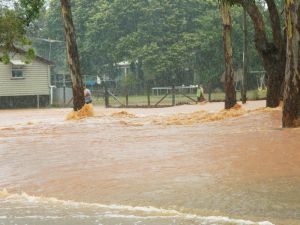
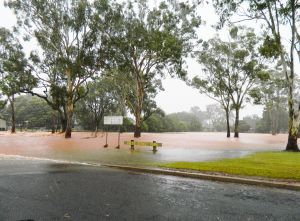
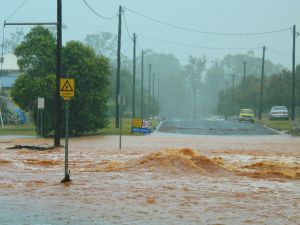
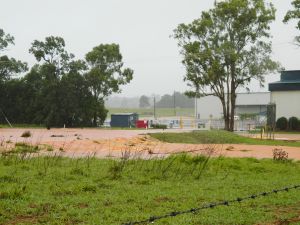
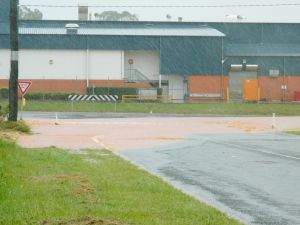
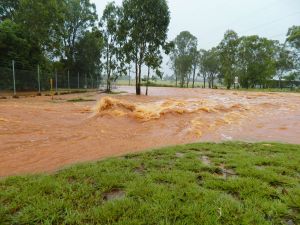
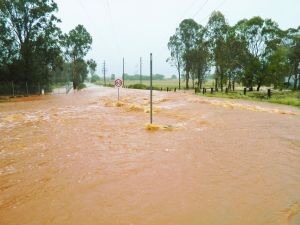
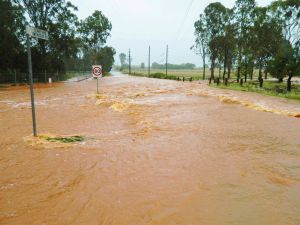
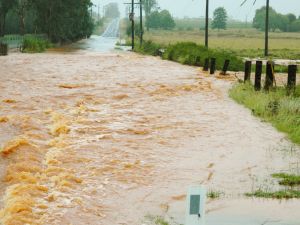
The view above is from our house in Kingaroy looking SW towards the Bunya Mountains. The equipment is supplied by Brisbane Storm Chasers. (1) These falls were the result of Ex Tropical Cyclone Oswald. The pics below around Kingaroy were taken on Sunday 27th
January, the Australia Day weekend,
At the corner of Kingaroy and Avoca Streets.
Readings are taken at 9.00 am
|
||||||||||||||||||||||||||||||||||||||||||||||||||||||||||||||||||||||||||||||||||||||||||||||||||||||||||||||||||||||||||||||||||||||||||||||||||||||||||||||||||||||||||||||||||||||||||||||||||||||||||||||||||||||||||||||||||||||||||||||||||||||||||||||||||||||||||||||||||||||||||||||||||||||||||||||||||||||||||||||||||||||||||||||||||||||||||||||||||||||||||||||||||||||||||||||||||||||||||||||||||||||||||||||||||||||||||||||||||||||||||||||||||||||||||||||||||||||||||||||||||||||||||||||||||||||||||||||||||||||||||||||||||||||||||||


| Date | Jan | Feb | Mar | Apr | May | Jun | Jul | Aug | Sept | Oct | Nov | Dec |
| 1 | .5 | |||||||||||
| 2 | 3 | .5 | ||||||||||
| 3 | 51 | |||||||||||
| 4 | 1 | 9 | 2 | |||||||||
| 5 | 3.5 | 7 | ||||||||||
| 6 | ||||||||||||
| 7 | 1 | |||||||||||
| 8 | 15 | |||||||||||
| 9 | 1 | |||||||||||
| 10 | 58 | |||||||||||
| 11 | 3.5 | 1 | 5 | 4 | 8.5 | 1 | ||||||
| 12 | 11 | 2 | 13 | |||||||||
| 13 | 10 | 9 | ||||||||||
| 14 | 11 | 1 | 26 | |||||||||
| 15 | 5.5 | 3 | ||||||||||
| 16 | 2.5 | 8 | ||||||||||
| 17 | 11 | |||||||||||
| 18 | 2 | 14 | 3 | 55 | ||||||||
| 19 | 5.5 | |||||||||||
| 20 | 1 | |||||||||||
| 21 | 40 | 3.5 | ||||||||||
| 22 | 42 | 8 | 5 | 6.5 | ||||||||
| 23 | 19 | 6.5 | ||||||||||
| 24 | 1.5 | 4 | 2.5 | 11 | ||||||||
| 25 | 98 | 11 | 6 | 1 | ||||||||
| 26 | 53 | 10 | 10 | 5.5 | ||||||||
| 27 | 9 | 4 | 43 | 1 | 4 | |||||||
| 28 | 8 | 15 | 21.5 | 2 | ||||||||
| 29 | 3 | 10 | 1.5 | 2 | ||||||||
| 30 | 1.5 | |||||||||||
| 31 | 1.5 | 2 | ||||||||||
| Monthly Totals | 188 | 162.5 | 63.5 | 28 | 21.5 | 131.5 | 51.5 | 4.5 | 7.5 | 21 | 137 | 25.5 |
| Days Rained | 9 | 12 | 9 | 3 | 4 | 10 | 7 | 2 | 3 | 4 | 5 | 6 |
| Cumulative Rainfall | 188 | 350.5 | 414 | 442 | 463.5 | 595 | 646.5 | 651 | 658.5 | 679.5 | 816.5 | 842 |
| Cumulative Days Rained | 9 | 21 | 30 | 33 | 37 | 47 | 54 | 56 | 59 | 63 | 68 | 74 |
|
|
| 2011 RAINFALL |
|
|
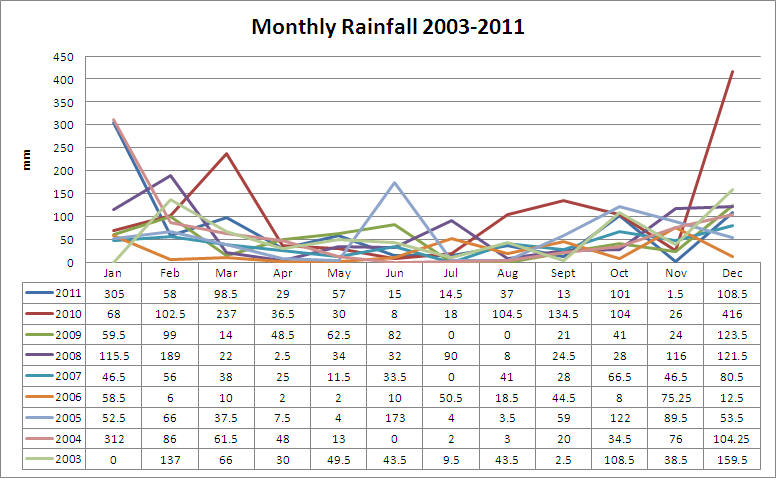
| Monthly Totals | 305 | 58 | 98.5 | 29 | 57 | 15 | 14.5 | 37 | 13 | 101 | 1.5 | 108.5 |
| Days Rained | 14 | 5 | 7 | 6 | 5 | 3 | 3 | 3 | 2 | 10 | 2 | 8 |
| Cumulative Rainfall | 305 | 363 | 461.5 | 490.5 | 547.5 | 562.5 | 577 | 614 | 627 | 728 | 729.5 | 838 |
| Cumulative Days Rained | 14 | 19 | 26 | 32 | 37 | 40 | 43 | 46 | 48 | 58 | 60 | 68 |
| Date | Jan | Feb | Mar | Apr | May | Jun | Jul | Aug | Sept | Oct | Nov | Dec |
| 1 | ||||||||||||
| 2 | 16 | |||||||||||
| 3 | 14 | .5 | ||||||||||
| 4 | 20 | 1 | 1 | 1 | ||||||||
| 5 | 35 | |||||||||||
| 6 | 14 | 1 | 4 | 1.5 | 6.5 | |||||||
| 7 | 16 | 1 | 12 | 18.5 | ||||||||
| 8 | 28 |
31 | 33 | |||||||||
| 9 | 16 | 3.5 | 3.5 | 30 | 5 | 4.5 | ||||||
| 10 | 48 | 6 | 30 | |||||||||
| 11 | 94 | 9 | ||||||||||
| 12 | 2.5 | 9 | 7.5 | 4.5 | ||||||||
| 13 | 4.5 | |||||||||||
| 14 | ||||||||||||
| 15 | 9 | |||||||||||
| 16 | 12 | 4.5 | 2.5 | |||||||||
| 17 | 24 | 2 | ||||||||||
| 18 | 4.5 | |||||||||||
| 19 | 12 | 17 | 12.5 | |||||||||
| 20 | 11 | 33 | ||||||||||
| 21 | 9 | 5 | 4 | |||||||||
| 22 | 28.5 | 3.5 | ||||||||||
| 23 | 3 | |||||||||||
| 24 | 11 | 7 | .5 | 2.5 | ||||||||
| 25 | 1 | |||||||||||
| 26 | ||||||||||||
| 27 | 10 | 18 | ||||||||||
| 28 | .5 | 20 | ||||||||||
| 29 | .5 | 2 | ||||||||||
| 30 | 11 | 3 | 7 | |||||||||
| 31 | 17 | |||||||||||
| Monthly Totals | 305 | 58 | 98.5 | 29 | 57 | 15 | 14.5 | 37 | 13 | 101 | 1.5 | 111 |
| Days Rained | 14 | 5 | 7 | 6 | 5 | 3 | 3 | 3 | 2 | 10 | 2 | 9 |
| Cumulative Rainfall | 305 | 363 | 461.5 | 490.5 | 547.5 | 562.5 | 577 | 614 | 627 | 728 | 729.5 | 840.5 |
| Cumulative Days Rained | 14 | 19 | 26 | 32 | 37 | 40 | 43 | 46 | 48 | 58 | 60 | 69 |
|
|
| 2010 RAINFALL |
|
|
| Monthly Totals | 68 | 102.5 | 237 | 36.5 |
30 |
8 |
18 |
104.5 |
134.5 |
104 |
26 |
416 |
| Days Rained | 7 | 8 | 11 | 4 |
6 |
3 |
3 |
6 |
10 |
7 |
7 | 20 |
| Cumulative Rainfall | 68 | 170.5 | 407.5 | 444 |
474 |
482 |
500 |
604.5 |
739 |
843 |
869 | 1285 |
| Cumulative Days Rained | 7 | 15 | 26 | 30 |
36 |
39 |
42 |
48 |
58 |
65 |
72 | 92 |
| Date | Jan | Feb | Mar | Apr | May | Jun | Jul | Aug | Sept | Oct | Nov | Dec |
| 1 | .5 | 46 | .5 | 20 |
1 |
1 |
1 |
|||||
| 2 | .5 | 13 | 58.5 | 30 | ||||||||
| 3 | 49 |
5.5 |
3 | |||||||||
| 4 | 6 | 1 |
3.5 |
|||||||||
| 5 |
6.5 |
10 |
17 |
|||||||||
| 6 | 90 |
60 |
8 |
4 |
||||||||
| 7 | 14 | |||||||||||
| 8 | 28 | 8.5 | 12 |
4 |
3.5 |
|||||||
| 9 | 2.5 | 2 |
39 |
3 |
||||||||
| 10 |
1.5 |
|||||||||||
| 11 | 4 |
59 |
10.5 |
9.5 |
||||||||
| 12 | 12 |
2.5 |
12 |
51 |
||||||||
| 13 | 3 |
.5 |
||||||||||
| 14 | ||||||||||||
| 15 |
1 |
1.5 |
2 |
|||||||||
| 16 | 20 |
28 |
||||||||||
| 17 | 2.5 |
61 |
||||||||||
| 18 | 2.5 | 10 |
3.5 |
1.5 |
1 |
|||||||
| 19 |
1.5 |
1.5 |
6.5 |
19 |
||||||||
| 20 |
5 |
18 |
9 |
74 |
||||||||
| 21 |
1 |
9.5 |
15 |
|||||||||
| 22 | 1.5 | 1.5 | ||||||||||
| 23 |
5.5 |
29 |
||||||||||
| 24 |
13 |
11 |
||||||||||
| 25 |
14 |
2 |
1.5 |
4 |
||||||||
| 26 |
3.5 |
19 |
||||||||||
| 27 |
50 |
|||||||||||
| 28 | 1 |
26 |
||||||||||
| 29 | 5 |
8 |
7.5 |
27 |
6 |
|||||||
| 30 | 28 | 1 |
5.5 |
2.5 |
||||||||
| 31 | ||||||||||||
| Monthly Totals | 68 | 102.5 | 237 | 36.5 |
30 |
8 |
18 |
104.5 |
134.5 |
104 |
26 |
416 |
| Days Rained | 7 | 8 | 11 | 4 |
6 |
3 |
3 |
6 |
10 |
7 |
7 | 20 |
| Cumulative Rainfall | 68 | 170.5 | 407.5 | 444 |
474 |
482 |
500 |
604.5 |
739 |
843 |
869 | 1285 |
| Cumulative Days Rained | 7 | 15 | 26 | 30 |
36 |
39 |
42 |
48 |
58 |
65 |
72 | 92 |
|
|
| 2009 RAINFALL |
|
|
| Monthly Totals | 59.5 | 99 | 14 | 48.5 | 62.5 | 82 | 0 | 0 | 21 | 41 | 24 | 123.5 |
| Days Rained | 8 | 9 | 7 | 8 | 6 | 7 | 0 | 0 | 3 | 7 | 5 | 10 |
| Cumulative Rainfall | 59.5 | 158.5 | 172.5 | 221 | 283.5 | 365.5 | 365.5 | 365.5 | 386.5 | 427.5 | 451.5 | 575 |
| Cumulative Days Rained | 8 | 17 | 24 | 32 | 38 | 45 | 45 | 45 | 48 | 55 | 60 | 70 |
| Date | Jan | Feb | Mar | Apr | May | Jun | Jul | Aug | Sept | Oct | Nov | Dec |
| 1 | 1.5 | 2 | ||||||||||
| 2 | 6 | 5 | ||||||||||
| 3 | 1 | 2 | .5 | 3.5 | 1 | |||||||
| 4 | 1 | 3.5 | .5 | |||||||||
| 5 | 5.5 | 19 | 8 |
9 |
||||||||
| 6 |
3.5 (plus a beetle) |
|||||||||||
| 7 | 2 | 4 | .5 | |||||||||
| 8 | 11 | |||||||||||
| 9 | ||||||||||||
| 10 |
.5 |
3.5 | ||||||||||
| 11 | 8 | .5 | 1 | |||||||||
| 12 | .5 | .5 | 1 | |||||||||
| 13 | 2 | 3.5 | 1 | .5 | 34 | |||||||
| 14 | 17 |
17 |
4 | 3.5 | ||||||||
| 15 | 4 | |||||||||||
| 16 | 8.5 | 30 | ||||||||||
| 17 | 1 | 4.5 | ||||||||||
| 18 | 13 | |||||||||||
| 19 | 10 | 1.5 | ||||||||||
| 20 | 5 |
46 | .5 | |||||||||
| 21 |
60 |
8 | ||||||||||
| 22 | .5 | .5 | ||||||||||
| 23 | 34 | 19.5 | 1 | |||||||||
| 24 | 1.5 | 2.5 | 1 | |||||||||
| 25 | ||||||||||||
| 26 | 2 | .5 | 3 | 1 | ||||||||
| 27 | 13 | 46 | 24 | 9 | ||||||||
| 28 | 1 | |||||||||||
| 29 | 11 | |||||||||||
| 30 | 24 | |||||||||||
| 31 |
|
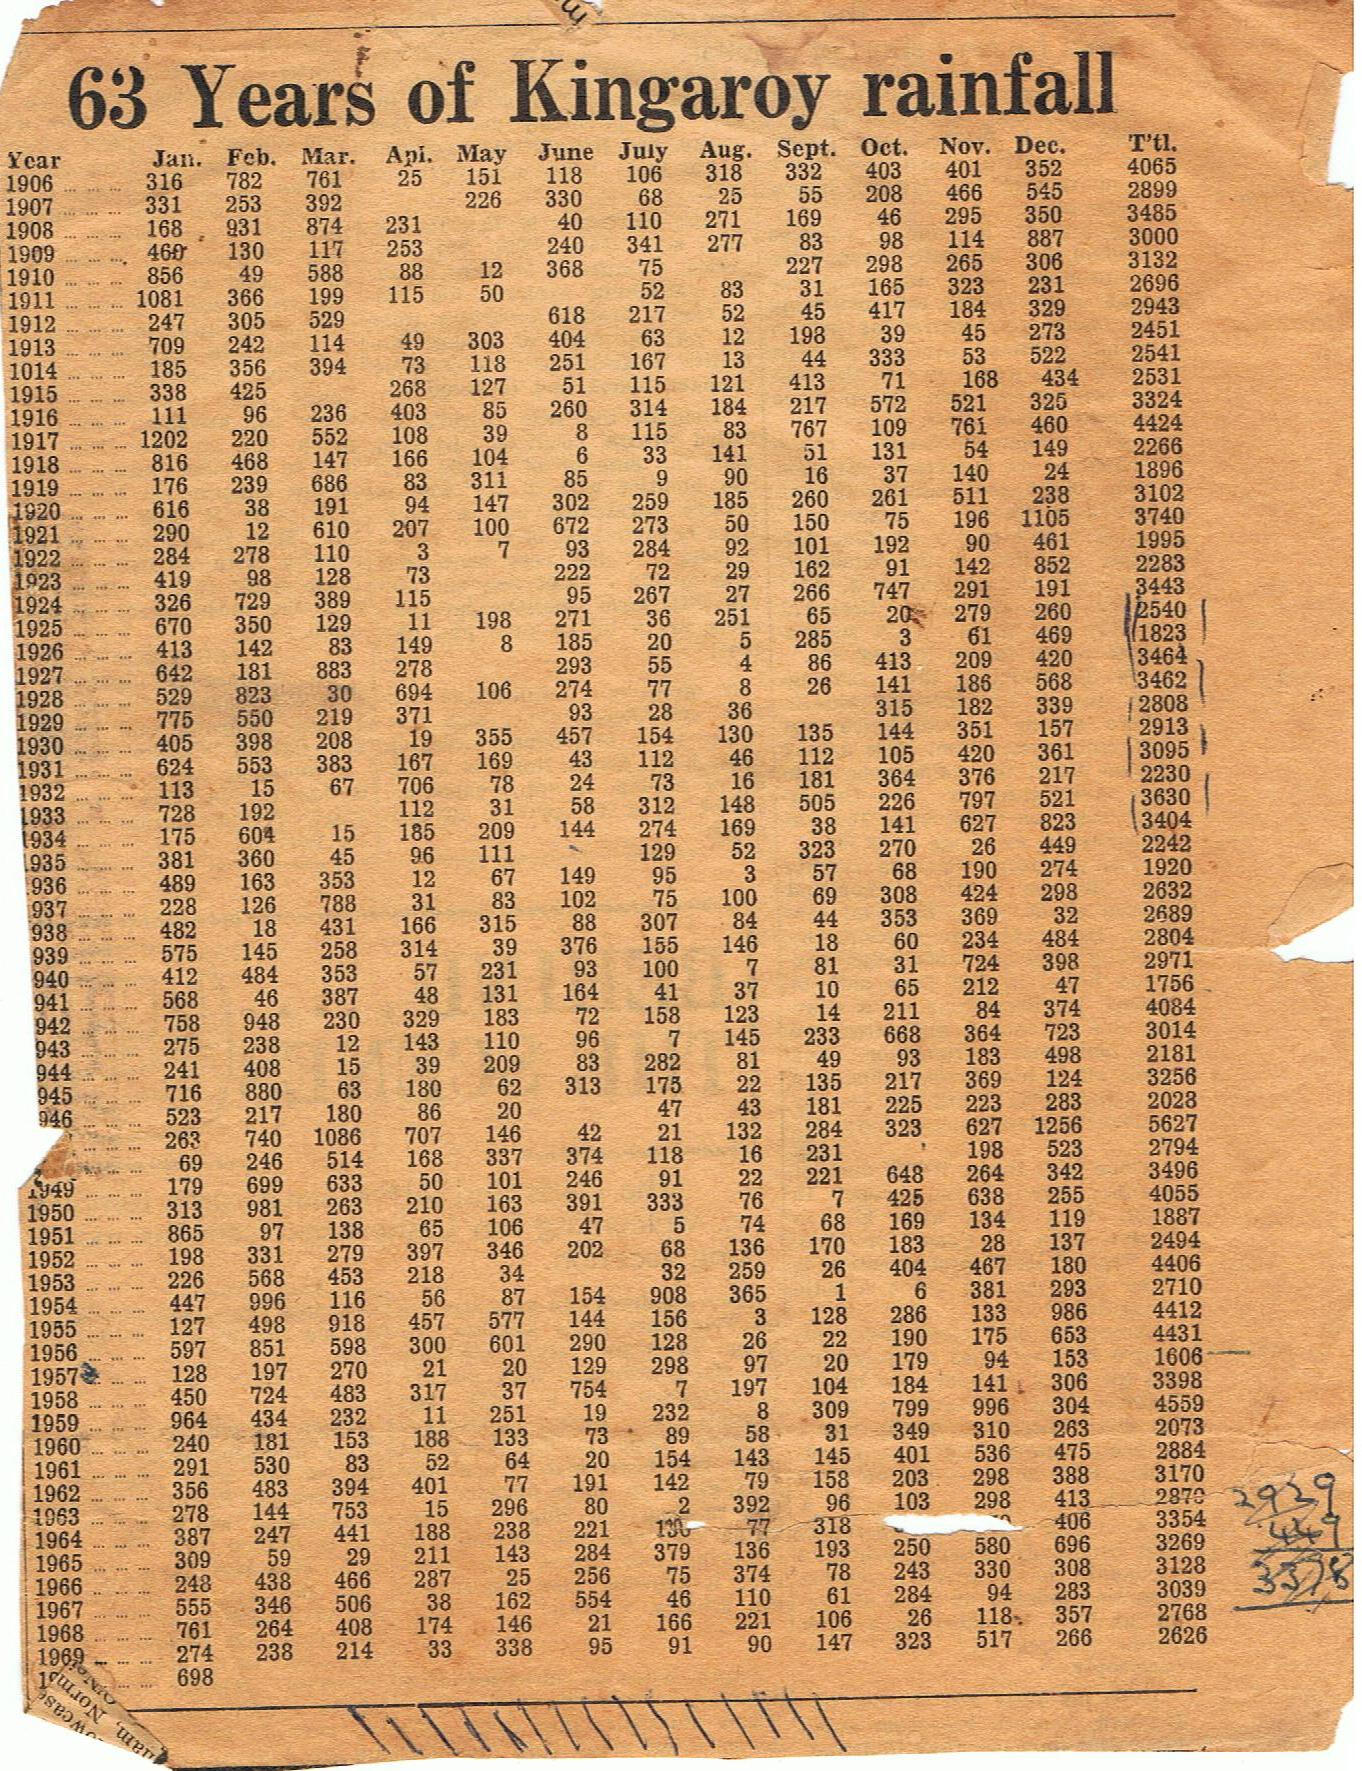
The above chart, converted from points to mm, is produced from a newspaper clipping in 1970. A schoolmate, Don Knopke, found it while cleaning his Uncles office.
|
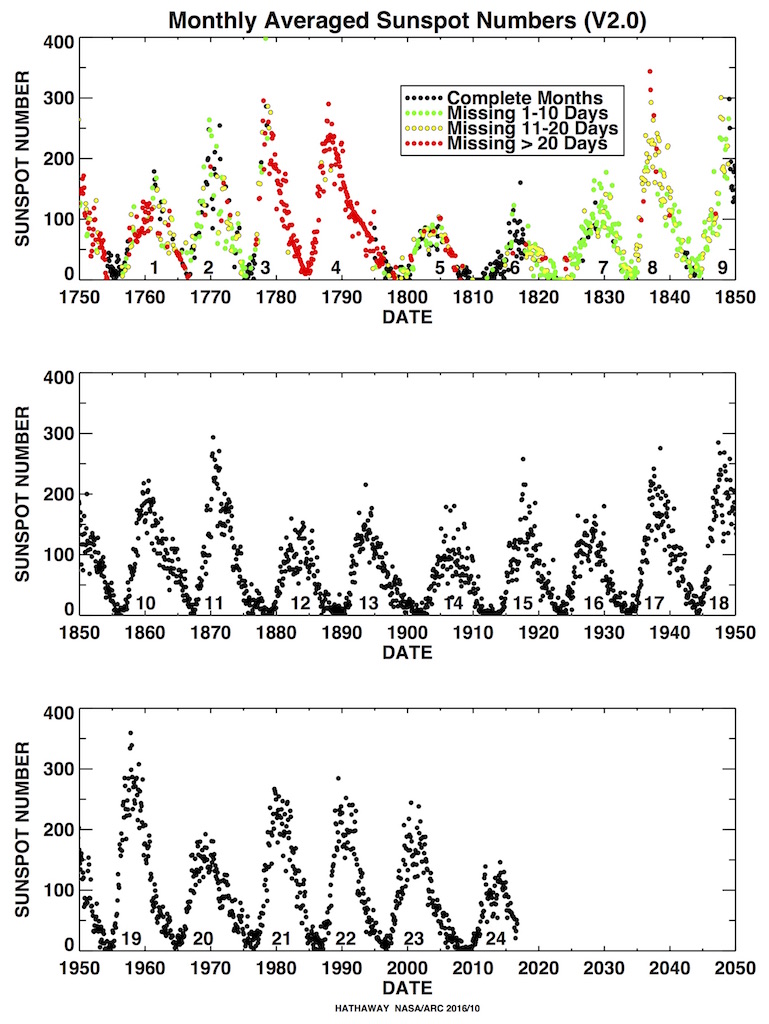
Thanks to
The Solar Physics Group at NASA's Marshall Space Flight Center
for the image below.
 >
>
Here is a
link to the graphs
shown below.
Thanks to
NOAA/Space Weather Prediction Center
Here
is another interesting site.

Last Updated : 07/01/2014 08:15 PM +1000